Friday, August 31, 2012

Devry (DV): Over-Extended Down-Trend

Devry (DV) flagged a confirmed BUY on my algorithmic DMA signal criteria. DV has been in a narrow range, the trend being down, then to sideways. Analyzing the trends duration and overall strength, its extremely over-extended to the down side, and is due for a bounce upwards.

Fundamental's

P/E: 9.13
PEG: 1.80
ROE: 10.31%
ROA: 7.71%
ROI: 9.36%

Although DV has negative growth as well as sub-par financial effectiveness, it is significantly undervalued with a low P/E & PEG-Ratio

Technicals

DV has found extremely strong support at the 18.30 level as its bounced of this level three times, even heavy volume trading days fail to penetrate this level, suggesting supply of TV is meet by demand from hungry bull bids on any weakness.


Mainline-Support holds, the key is to break the pivotal point of 21.50 to launch DV back to mid 20's


 A Rising CMF indicator crossing the zero line shows a Positive Bullish-Divergence for DV


Short term momentum oscillators across the board flag DV as both over-sold as well as crossing on the STOCH 20 line which is a reliable BUY-Signal when the current momentum position of DV stock as being  currently oversold.


Above we can see a massive Positive MACD Bullish-Divergence signal, this shows DV is due  for a move to the upside, the divergence continues to get tighter showing that a move in volume and direction is very probable shortly.

Overall DV is lined up to be a bounce play off of mainline support as the oversold conditions of the DV are over-extended and buyers will step back in to take speculative positions in anticipation of DV's subscription base to increase as the fall is their best season for revenue flows.

Position: Long- 18.98 500 shares.


Wednesday, August 29, 2012

Barnes & Noble: Over-Sold Descending Wedge Trade


Barnes & Noble (BKS) has flagged a buy from my Directional Discretionary Technical System today. BKS has been in a long term trading range, hovering between the $20 dollar over-head resistance level, and the $10 mainline support. Before we analyze the chart, lets look at some fundamental valuation of the company. I'm looking to long BKS from $12.25  to $13.05-$13.10 for a trade only. Would be 75% equity holding 25% (100 September call options) strike price $13.

Fundamentals

  • Peg Ratio of .8 (extremely low) indicates that the price of BKS stock is undervalued.
  • Debt to Capital Ratio of 25.78%, this is good it shows BKS is not significantly over-leveraged, the industry norm is 35-40%.
  • 56% of the stock is held by institutions and insiders.
  • 34.57% of the stock is short (high short interest).
BKS earnings 2012 beat the street consensus of a .98 loss with a .78 cent loss, due to increasing sales of Kindle Fire product, which is a strong real competitor with the apple when it comes to tablet reading. This is also a positive indication for a potential turn around of BKS sub-par profit and revenue numbers in recent years. EPS growth is 21% which is within industry norms but very good for a company as large as BKS.
 
Total revenue has increased from 5 billion in 2009 to 7.4 billion to first quarter 2012, that's a 2.4 billion dollar increase in revenue due to over 7 million kindles being sold in the last 3 years...and its only gaining stronger momentum in the electronic retail sector of tech spending trend in the retail world. ROE, ROA, ROI are substantially below industry averages but this is due to the BKS being the market leader and largest player by far in brick and mortar book retail.

Technical's, Price Action


BKS stock has bounced off the $10-$11 dollar mainline support level three times this year. Even on heavy volume down days, BKS failed to penetrate this support level, confirming this to be a non-catalyst/event driven bottom. Currently in the past 3 months BKS has been in a Falling Descending Wedge pattern, which is a short term bullish reversal pattern, which is ranked 11 out of 19 (Bulkowski Chart Patterns), the pattern has a 65% chance of rising and a average gain of 26%. Contraction of volume is here at the beginning of the wedge as well, which only furthers the reliability of the pattern.


BKS has a positive MACD divergence signal, this is an extremely reliable indication a short term bounce is in order, also the MACD signal line crossed today showing positive momentum is due extremely soon. Also slow stochastic momentum crossed the 20 oversold level signal threshold level, also indicating BKS to be in a over-sold state due for a bounce.


My specially designed Double Smoothed 5EMA True Strength Index Double Cross-Over System has also indicated BKS to be vastly over-sold, a buy signal occurred today, and BKS is well on its way to reaching the -.25 over-sold signal line as well.

Overall with the series of low discounted fundamentals, over-sold technical's and 34% short interest, BKS is due for a quick move to the low to mid 13's in the coming two weeks, i would recommend BKS stock as a short term momentum play, due to some short covering (squeeze)action.


Sunday, May 6, 2012

S&P-500: Tumble Comming More Than Likely

  So with Sarkosy & Merkel beng defeated by complete nut case left-wing communists its safe to say the market will undoubtley react towards there bizzare statements such as Tsipras’s calls to tax the rich, delay debt repayments on Greek Debt, and Hollande to simply, not austerize anymore...that will work well because they are a currencer issuer and not a user....*que heavy sarcasm*

But i predicted all of this weeks ago and positioned myself in cash to short this sucker, but using advanced Technical Analysis this was very apparent.


Multiple Top Chart Pattern


Sunday, April 29, 2012

Apple (APPL): Rounded Top :Trend-Over-Extension


 There has been all kind of talk on AAPL failing to make new highs after their block-buster earnings announcement last week.  To put it simply this is a bearish picture for the tech-glamour stock.


  • Rounded Top formation pretty evident.
  • Heavy selling volume last week, weak buying volume.
  • If $600 breaks you can expect a retracement to $560-$550
  • Earnings were amazing....why didn't arbituer's correct the price back to last weeks highs? Sentiment is bearish long term, that's why...bearish picture for economy = demand for apple goods will be much lower.


  • To much Over-Head Supply on market = Strong Over-Head Resistance.
  • If we cannot get past $625 on strong volume, then a fall below 600 is 100%.
  • If moving past resistance fails, then we can expect testing of $560 level due to support failure.

Overall Apple has had an amazing run, but it seems to be to risky to not take profits on this mad winner, since it appears a Rounded Top formation is the case. I expect if we break 600, AAPL falls to 570...then if no rebound the downtrend will continue.


Tuesday, April 24, 2012

Gold Star Resources (GSS) : Descending Wedge - Multiple Bottom


Pattern & Technical Analysis

      Loving this chart, GSS trading at 52-week low, due to bearish outlook for mining stocks etc, GLD + XLB are not the hottest trading ETF's but GSS is significantly under-valued. Lets have a look.


We can above the multiple bottoms and the Descending Wedge Pattern : Bullish Reversal Pattern


We have established strong support at the $1.50 mark, this leads be to believe that supply is being meet by demand here...and this 1.50 mark as stopped over-extensions in supply in the past 4 months, hence the phrase "strong" support. It just appears bears cannot push GSS past this level.
  • If $1.60 is pierced then $1.80 is the next level.
  • If $1.80 is pierced and we get over the $2 mark, then we are looking at a legitimate possible long term trend reversal, Wedges are know for this kind of reversal action.

    We have strong support established, as well as an observable rounding bottom formation at the last touch of this wedge. The wedge channel lines are contracting nicely as they are suppose to, so i believe the bounce off of this 1.50 mark, will be the bounce that pierces the wedge.


Momentum Analysis

Momentum indicators across the board scream over-sold, a we have some specialized momentum indicators with buy signals which i will show below.


5 Day EMA crossed %R in at Over-sold level: Bullish


5 Day EMA crossed True Strength Index at Over-sold level: Bullish


Stochastic & Momentum indicator cross over, plus turning upwards nicely in the Over-sold region of the chart.

   Momentum analysis suggests GSS is definitely over-sold and due for a nice run here shortly. I agree, all the indicators are very over-sold and are turning upwards to climb out of the rut GSS has been in. This is all very bullish for GSS, we can see indicators across the board suggest its time to buy and ride a new wave of positive price action.


 We also got a MACD cross-over taking place as well as a MACD Divergence signal: Super Bullish especially for long term price action.

Volume Analysis


Volume indicators show a decrease in volume over the past two weeks. This is typical in the Descending Wedge Pattern. OBV plus A/D suggest steady accumulation at these price levels with alot more to come.


Entry Strategy

 Based on some of the analysis methods of my system, this is a high probability trade. I think tomorrow we will open either at 1.55 or a penny or two below or a above, depending on the markets overall open, which should be up. I would start by buying a couple 5k block shares with a tight limit. Just test the waters to see if the bottom is legit. We saw a nice hammer candle form today, which is a bullish reversal candlestick.
   
Overall GSS looks like a great bottom trend reversal play, and since its ADX rating is 17 is definitely in a oscillating zone and indicators should be used to judge if it is over-sold....**which it certainly is**......i going to initiate a 70,000 share position, around 1.60 tops.

Position: Long

Target: $2.45

Monday, March 26, 2012

First Nationa Bank (FNB): Push Higher, Or Dip?

Price action today for FNB's stock was quite interesting, this chart set up as well as equity analysis for FNB leaves us with a interesting Picture.

Basic Chart & Pattern Analysis

Adam & Eve Double Bottom: Characteristics?
  • Appearance: Double Bottom with one narrow & one wide bottom, break-out upward.
  • Short Term Bullish Reversal.
  • Performance Rank: 8 out 0f 23 (Bulkowski Back-Tested.)
  • Average Rise (statistically speaking): 37%
  • Volume Trend: Downward during formation of pattern.
What we can see is FNB has recently had a confirmation of the short-term bullish reversal pattern over the past 6 trading days. The pattern is pretty evident and almost text book. The pattern is tall & has formed at yearly highs, which adds further confirmation to a continuation of the trend reversal upwards.


Also We Can See

  • Bull flag, occurring after confirmation of Double Bottom pattern = Very Bullish, bull flags are a very reliable bullish continuation signal, just shows a trough (buy on dip) in a up-trend.
  • Described declining volume during formation of pattern.
These two patterns formed over the past two months if a very strong indication that the uptrend for FNB has some more room to run higher. Overall pattern analysis flags FNB as being bullish.


Trend Extension Strength + Momentum


Currently FNB is in an Oscillating Range Via Trend Extension, so the best way to analyze if it is Over-Bought or Over-Sold is to use indicators and oscillators. As we can see above...
  • RSI turning upwards to cross 80 line.
  • Stochastic Cross-over in progress over 100 line.
  • Momentum indicator to make another run higher
So what this more-less means is that the trend has been bullish for many months now, but it still has room and strength for a continuation upward, but obviously is not at a discount by any means via Technical Analysis.

Volume Analysis


Volume action for FNB is clear. Accumulation, Accumulation, Accumulation. This is all very bullish, and shows that even tho the price ran down several times, back-door accumulation by professionals as well as noise was occurring. This shows the demand for FNB stock has consistently been on the rise, and the volume indicators alot more accumulation to come.

Entry Strategy

The only thing i did not like today was FNB long-legged Doji Candle-Stick on an increase in volume. This Candle-Stick occurs when supply and demand are equally meant, and shows legitimate indecision between Bull's & Bear's. But it did still close green so that is better than red.

Regardless i think to enter FNB as a trade it obvious bull's may be tiring for the moment, tomorrow mornings price action based off of volume will indicate if we see a minor trough-blip or a solid rise tomorrow. If the minor trough-blip occurs, i expect a short-run retracement to $12.12-$12.15. But i think within the next two weeks FNB should close around $13.70-$14.05 Range.

Overall the Trend is still got room to rise higher, and is strong, on a multi-month chart perspective low 12's are a good entry, for a nice 7% to 9% pop. Tomorrows price action (which i expect to be down) will tell us alot about the short-run direction of FNB's price, but long-term, the chart is a confirmed BUY, once it pulls back to the low 12's.

Position: Long

Target: 13.80 - 14.05 (Next 2-3 Weeks)


Sunday, March 18, 2012

Hyper Dynamics (HDY) : Ascending Triangle Break-out

In the past month shares of HDY have been pounded, following the speculative oil company's failure to spud legitimate oil from their SABU-1 oil well. Regardless the stock plunged from from $2.50 range in late February to the $1.30-$1.40 range through-out this month to this day.

HDY has been bouncing consistently off of the 1.30 support line, this proves to me that the intrinsic supply & demand point has established this price area as being mainline support as well as a price bottom..

Pattern Analysis


What we can see is a few things
  • Text book Ascending Wedge
  • Gap to $2 to fill.
  • the 5th point of the 5-point Ascending Triangle confirmation pattern line is due to touch come Monday.
  • Morning Star Pattern formed in the past 3 days of trading, as well as a bullish engulfing pattern. Both being strong reversal candle patterns.

Volume Analysis


    Above we can see that Accumulation/Distribution & On-balance volume have been oscillating in a range with HDY's price action, this downward sloping trend in volume (light volume since gap down as well) is confirmation a large move is to come, and based off of the chart it looks like a bullish pennant for the volume pattern.
    The supply of HDY on the market has been meet by serious demand in the low 1.30's, volume dictates an over-extension in supply, and bears are loosing power and grow tired. Also there is a 25% short float on the stock, this means shorts will cover once bears loose steam, bringing a major short squeeze play into play. Which will blow HDY's PPS close to 1.80. The continuous decline in volume ended Friday with a 11% gain on 12.4 million shares. That's huge when AVG volume is 3 million shares.
      
    Volatility Analysis
    

For volatility analysis we can see the following
  • Contraction in volatility, squeeze is in progress, this will expanded either upwards or  downwards, and oscillators and momentum indicators strongly suggest upwards.
  • %B indicator shows bounce and should easily pierce 100 line upper band tag.
  • A move is coming soon. Volatility would indicate another swing upwards short term.


MACD Divergence


 We can see a massive divergence signal in HDY's price action as well as its MACD histogram reading. This is a high bullish indication for HDY and also further suggests another run int he equity.


Overall HDY is flagging a buy on many more indicators and analysis methods, i only covered the more important ones. I believe HDY is poised for another major run here shortly. I do currently own 125,000 shares of this company, i purchased last week as well for a nice swing trade.


Position: Long


Target Price: 1.72-1.80 (High) 1.63-1.70(Low)


Sunday, January 29, 2012

Akamai Technologies: AKAM 20% Break-Out Play

AKAM has recently been flagged as a buy,on my discretionary short-run trading system. What we see here is a very profitable application's software company, that runs a very efficient corporate operation. they have an amazingly strong balance sheet, with little to no debt , and do much of their work directly with Apple, as we all know, just had a valuation raise to $560 a share.

AKAM being one of the more profitable companies in the computer service industry has a great pre-break-out chart set up as well, lets take a look.


Above we have the following.


  • Stochastic Over-Sold Crossing Signal.
  • Momentum turning towards a reversal across the 100 line, which is the confirmation to buy.
  • A reliable Ascending Triangle Chart Pattern.

Bollinger Analysis

  • We can also see here from our Bollinger Analysis is that the bands have contracted, indicating that a breakout, either being up or down is due here relatively soon, and since AKAM is in a consolidating oscillating range, using oscillators is the best way to determine if it is under or over priced.
  • Based off of the evidence the indicatoror's suggest that both Bollinger %B and CCI as well as Stochastic & Momentum indactors show that AKAM is oversold greatly.
  • Evidence also suggests AKAM is poised to break-out upwards
All in all, what we have is a financially strong, profitable company, that based off of Technical Analysis is greatly oversold and is poised to climb to a solid $40.00 in the next 3 weeks.

Position: Strong Buy

Target Price: $40.50-$41.00

Sunday, January 22, 2012

Pacific Ethanol Corporation PEIX : Ascending Trinagle Breakout

PEIX is candidate for a easy 15-20% gain. The ethanol producer (being on of the largest producer/distributors on North America) has been trading in a tight consolidation range of an ascending triangle for several days now with declining volume.


  • Ascending Triangle formation, meeting textbook parameters, this chart pattern in a smoking gun for a bullish-reversal due any day now.
  • Declining volume, also goes in par with further confirmation of the ascending triangles up coming bullish movement.


  • Contracted Bollinger Bands also show a movement in price action will occur any day now.
  • Momentum indicator is hugging 100 line, showing the current consolidation in progress as well

Overall PEIX has to move and sometime soon, as we have seen volume gradually fall lower and lower well below the 50-day moving average (of volume) its safe to say we should see a break upwards come Monday or Tuesday, Wednesday at the latest.

I predict we will see the triangle formation broken upwards tomorrow, and the run should be to $1.45-1.50 range.

PEIX: Strong Buy

Price Target: $1.45

Sunday, November 6, 2011

Breakout: Sprint

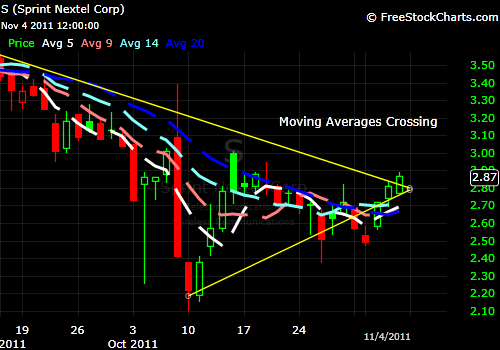
Sprint (S) recently came across my system as a buy based off of some interesting continuation pattern signals. Below is an analysis of some reasons to consider this a high probability equity trade.


  • Ascending Triangle Continuation chart pattern....broke past the pattern line early Friday morning signaling a buy.
  • MorningStar candle pattern followed by a Three White soldiers Candle pattern, both are trend reversal patterns.
  • Declining volume In sync with ascending wedge pattern.


Moving Averages are crossing...and are starting to head forward.

DMI +/- is about to cross as well. All in all sprint is treading near its 52-week low point...and has many indicators and bullish signals going on here. I think a trend reversal is definitely in progress..and Friday was the confirmation day. Buying in right prior to a breakout is how the big gains are made. What really nails the head on this situation is the candle patterns. A Morning star sharing with a Three White Soilders pattern is very rare...and both are very high probability bullish trend reversal patterns.

Position: Long S


Thursday, October 27, 2011

TrinQuint Semi-Conductor: Volatility Spike Play.

Shares of TrinQuint Semi-Conductors (TQNT) tumbled 26% today during trading, due to a failure to beat Wall Street earnings expectations, and had a negative growth forecast due to Apple scaling back on orders for their computer hardware parts. TQNT supplies chips for Apple, the bulk of their business is done with Apple. For more here is the story. http://www.marketwatch.com/story/triquint-announces-third-quarter-2011-results-2011-10-26

 
Regardless, my trading fund has a Relative Value Volatility Arbitrage aspect to it, so anytime i see a equity get hit real hard real fast on a rapid negative volume spike, it comes up on my radar as a possible share price bounce play.


What we can see on the chart above is TQNT was in a long term giant Head & Shoulders chart pattern, and in early October it finally bottomed out and began a new trend upwards. What happened last night was a event driven, fear induced panic, that made people all blow out simultaneously. In reality a 10-15% pull back would have been a understandable behavioral reaction.....but 26%? Definitely way to oversold.

 
What we can see is:
  • Massive sell off occurred on high volume. Generally after a giant down day like this, many traders and investors will come up and snag a bunch of shares at a discount price (in their mind) and will help retrace some of the losses from the prior trading session.
  • Volatility: Any 30% price move in one day, will eventually lead to a mean reversion to moving averages or linear regression lines. This event is not that serious that it wont recover from this behavioral sell off.
  • The Professionals: Best believe Market Makers, Hedge Fund Managers, Professional Equity Traders will come in and accumulate this stock for a easy 10-15% pop upwards in the next coming weeks. 


Above:  Linear Regression Analysis.
  • Above we can see that TQNT is trading well below its linear regression levels by at least .45 cents a share. We can fully expect to see a reversion to that mean of 5.80 within a few weeks at the latest.
  • 60 day Lin-Reg line is at $5.80 Per Share
  • 30 day Lin-Reg line & Lin-MA is at $7 Per Share


Above: Mean Reversion Analysis Using Simple Moving Averages

  • All moving averages suggest a reversion back to the mean target range of $6.25 Per Share on a monthly basis & $7.00 Per Share on a Weekly Basis.
  • Realistically longer ranging Moving Averages are more accurate after short term event fluctuations.
In the end TQNT may have some issues, but its appears to be very oversold at this point, i believe it bouncing back to 6.50-7 within a month is not a unreasonable assumption and should come to fruition. But with the market acting the way it is nowadays, anything can happen.

Position: Long TQNT

Thursday, September 15, 2011

Hyper Dynamics Corp: Break-out Deja Vu?

Hyper Dynamics (HDY) has recently been flagged by multiple signals from my system as a possible pre-breakout phase, consolidated equity. We have been down this road before with this equity, it proves to be profitable time and time again, and its the same pattern we see now that we saw before the last breakout. Lets take a look.


What we can see?
  • Contracted Bollinger Bands. Volatility is becoming contracted, when the BBands contract, it always leads to a new trending direction.
  • My 13,26 Dual Moving Average system crossed over, signalling a buy. Every time this system crossed over, a new upwards trend began.
  • We can see a classic Bullish Pennant or Wedge its debatable but both are consistently profitable.

In association with volatility contraction and the formation of a very reliable and profitable chart pattern, we can also see that HDY has fallin into a consolidation non-trending sideways trading range. What that means is simple, before periods of great share price movement there is normally a consolidating or small range of price change.
  • ADX signals non-trending, consolidation.
  • ATR signals non-trending, consolidation.
  • Bollinger Band Width signals non-trending consolidation.
  • DMI/+/- is about to cross-over.
What this means is there is going to be a breakout in share price, and soon. The million dollar question is what direction? Well there is limited reason to believe it will break-out downwards. This exact same pattern formation a month ago lead to a 35% gain. Here are some reasons why it will break upward
  • Months of large institutional quite buying.
  • Large insider share buying.
  • Tomorrow, September options expire, strike price is 4$ and 5$, Algos say 5$ is the target, meaning that HDY should soon be pushed to 5$ per share.
  • Declining Volume, which is 90% accurate when used with a pennant as bullish confirmation.
  • Large community bullish sentiment
  • HDY's recent promotion from the AMEX to the NYSE
  • Current candlestick is at the Pivot Point. Suggesting a move.
Some of my other Oscillators such as MACD and Stochastic's also indicate a buy signal.

All in all i think HDY is poised to breakout upwards once again. I would estimate based off of volatility range and previous breakouts, we can see HDY hit $5.50 a share to possibly $6.50 a share.
Lets hope this bad boy blows upwards come Monday or Tuesday.

Position: Long HDY


Wednesday, September 7, 2011

Alcoa Inc: New Upward trend in development?

I recently placed a large trade on Alcoa Steel at 12.11$ a share. Seems to have been a casualty of the recent market sell off last week. The companies fundamental's have not changed, so obviously it's recent 2$-3$ fall in share price is a result of funds selling off positions out of fear, and Alcoa's shares getting tied up with the indices recent retracement.


I believe this to be a Bullish Pennant, although due to recent overall market volatility its hard to find accurate continuation patterns, so it may be a Triple Bottom with a breakout to come soon. Here are some thoughts.
  • AA is at a 52-low area
  • AA is current trading at its pivot point area.
  • AA's lowest short term support level is $11.11
  • 10 day SMA crossed over 20 day SMA, as well as ADX declining at 35, this suggests a new upwards trend is to begin, and todays recent small gap up may be the beginning of new upwards movement.
All in all i think AA is a potential bottomed out equity that is poised to at leas hit 12.75$-13$ a share with the next week or so.

Position: Long AA

Sunday, August 21, 2011

Shorting The Euro: Breakout or Further Consolidation Squeeze?

In the past 8 trading days we have seen much volatility in the in market due (primarily) to the banking/debt crisis in Europe. Overall with all clear an increasing bearish outlook for the EU's financial situation, which i will not go into depth or detail that is for a macro-analysis article, i decided to investigate the ETF EUO (Pro-Shares Ultra Short the EURO). More-less i believe the EU is poised to have a de-valued Euro, due to the economic cascade, and eventual first domino to unfold in the region.

The charts typically do not lie, so i analyzed EUO's price history and found a few current and developing Buy Signals.


Above we have the set-up for a incredibly reliable (92% Bullish-Breakout) Bullish Descending Wedge.

The wedge, while visibly apparent, is technically incomplete. The rule of thumb 5 reversal points must touch the wedge channel lines in order to have a confirmed Declining wedge.

So far EUO has touched the channel line 4 times, leaving the 5th, in my opinion to occur between the 16.75 to 16.55 price range. I believe that further consolidation and sideways trading are yet to come...to form the final breakout area of EUO upwards. Looking at oscillators in a sideways trading range is necessary when determining the breakout-direction.


Lets see what we have above via Oscillator Analysis.
  • Bollinger Bandwith close to approaching the 0.0 Buy signal line but also shows that sideways trading poised to breakout shortly.
  • Bollinger % B also close to approaching the 0.0 Buy signal line also.
  • Stochastics Show that EUO is closing in on a buy signal but not quite there. (in accordance with my analysis it has some room to pull back yet)

More Oscillators for analysis.
  • CCI shows EUO to be oversold, suggesting a buy signal.
  • ADX shows a new trend is soon to take place.
  • Directional movement doesn't not support any bullish confidence, but DMI is also very mechanically trading based and is very lagging.
  • MACD tells us we have some room to fall yet, but a reversal also seems to be in the works.
All in all its clear the Bullish Descending Wedge is in current formation, further consolidation and side-ways trading will continue for a short time frame. All oscillators suggest EUO is oversold. All Trend-Directional Movement indicators suggest a major reversal trend is due to come as well.

Taking a position now or waiting for further confirmation is trader discretionary, but regardless its pretty apparent, based of Europe's situation that EUO is a long call.

Position: Long EUO

Wednesday, August 17, 2011

Advanced Micro Devices Part 3: Risk-Free Arbitrage Play or Possible Bullish Momentum?

AMD (Advanced Micro Devices) fell -3.33% in late hours trading today, due to Dell Quarterly revenues more less being stagnant and growth-less. With that being said we can see the sell off was related towards the psychological reaction to dell stock selling off (since AMD chips are in Dell produced computers) i expect this sell off to be more so news reactionary than fundamentally sound.


Based off the technicals above we can  see a few things.

  • First off AMD could be a example of a Descending Bullish Wedge.
  • CCI and DMI-/+ may suggest its bearish trend to be coming to a end soon, indicating towards now being a potential buy point. Mind you i buy in before mechanical's say go, because i appreciate getting on a train before it leaves the station lol.
  • Parabolic SAR has been descending for a while, its about time for a mechanical turnaround.
Overall a reactionary behavioral response to a quick trending equity such as AMD is almost invariably going to have a pullback day. Today was it. The next few days should prove to be bullish....i would guess hitting 7$ a share in a few weeks wouldn't be to far'fetched of an idea.

Position: LONG to 7$-$7.20

Friday, August 5, 2011

S&P 500: The Short Play.

Well folks, look at the market the past week, were down 4% for the year easy. Now if you read my very first blog "Macro-economic analysis" you would have somewhat expected this to happen after the massive commodity bubble, that came to be/exists. So what can we expect in these times of serious uncertainty.
  • S&P falls 147 points in the past two weeks.
  • Standard an Poor's downgrades U.S treasury bonds/yields from AAA credit rating to AA credit rating.
  • Weak economic growth reports produce fear.
  • Investors/ Mangers/Funds loose faith in USD and U.S economy

 It mean its truly been a blood bath this past week. On top of that while everyone is expecting  this "correction" or "bearish run" to bounce off current levels, i tend to find that to be false optimistic bias. We have a growing number of unemployment claims, a failed FED monetary policy, awful global macro-economic issues occurring in Europe and at home, and top of this outrageously high commodity prices, destroying consumer purchasing power to re-invigorate aggregate demand.

Its simple, bond yields have been sky-rocketing in Europe and they will be sky-rocketing here in the U.S as well in time. When yields rise people become pessimistic on our countries financial strength, when that occurs we will see systemic paranoia, and fear induced panic in our financial markets, so expect an average downward trend of our major index's to continue.

Overall i suggest betting against the markets overall trend buy purchasing shares of ETF: SDS
We may see some periods of bullish investors buying up equities at a "discounted price" but that is simply a illusion created by mental accounting, and representative biases. In reality come Monday we should see a drop in the markets...your entire countries credit rating getting dropped on a Friday night cant be good...seems eerily similar to Washington Mutual's Fed seizure back in 2008. The weekend before it dissolved.

Expect serious market movement downwards Monday.


Position: SDS Long

Thursday, July 21, 2011

Hyper Dynamics: Confirmed Bullish Upwards Trend!

So it appears proper due diligence has paid off.....score one for Inefficient Markets Theory this pas week....as i said on my previous blog... Tuesday would be the day of the HDY price take off....12% gain that day...and its been trending upwards since..

What we are witnessing is a combination of group dynamics....shorts covering their positions...and associated longs, jumping on the train as the engine is starting at the station.


Above we can see that a new upwards bullish trend has been established and is in the process of a continuation upwards. (Blue lines indicate bullish trend lines) This does not come as much of a surprise, based of the analysis of my previous articles.

Resistance was broken at 5.16 today....i found it amusing that whether the shorts or some other market player or power broker wanted to keep a lid on that price..and failed. I witnessed many big multi-hundred thousand share sell blocks get eaten through by bullish volume. This leads me to believe that the massive 20% short postion on HDY (with 4 days left to cover) are getting desperate in finding and exit from their trade. It seems to me some major institution is trying to force HDY down to a lower price to minimize their losses.

Overall the current situation is now obviously a new bull market for HDY. Here are some other points
  • $5.45 is the next resistance point...if we can pierce that by Monday- or Tuesday......it should be easy to hit $5.90-to $6.15 a share.
  • This is a short squeeze in process....as the price continues to climb acceleration of PPS will increase due to the squeeze.
  • Volatility will increase due to the squeeze...so expect a constant battle between intra-day long and sell positions.
  • Either way this new bullish trend has a ways to go.
  • Last but not least...we can expect major upwards PPS movement after the NASI announcement due any day now.
All in all the trend has been confirmed...so lets sit back and watch the direction of the trend.....but being weary of noise traders jumping aboard the train...irrational exuberance is a reality in every bull run...one must know when to properly exit the trade and take profits!!!

Thursday, July 14, 2011

Hyper Dynamics (HDY): Further Bullish Breakout Confirmation.

Mechanical trading system indicators blew up today...they show further upcoming bullish trend confirmation signals after the last two medium volume volatile trading days.


In the chart above we can see three things.
  • The mechanical Parabolic SAR has recently turned bullish showing a upwards trend to be beginning in process.
  • The +DI line of the Directional Movement Indicator is above the -DI line right when he Parabolic SAR is suggesting a new upward trend. 
  • Candle Stick's are settling at resistance points instead of breaching support points on daily charting.
When Parabolic's change direction to bullish..with a confirming Direction Movement Positive line above the Directional Movement Negative line..this almost invariably is a ironclad confirmation of a bullish breakout since possible whipsaws from the Parabolic SAR  can be ignored. Coupled with the incredibly contracted BB bands its blatantly apparent we will see a breakout any day now...most likely Monday, Tuesday or Wednesday..but probably Tuesday.

All in all, the Bullish falling wedge continuation pattern is still in effect. To be quite frank, i have not seen so many indicator's and pattern's align themselves together to basically say long this security right now...i mean this is like the planetary alignment of Technical Analyisis Indicators...its amusing...

Regardless its apprarent short sellers and market makers are holding this stock down so they can have more time to sell to cover..or accumlate more shares at a discounted price over a duration of time to avoid loosing potential spread points of massive bullish buying energy...

All in all, the time to buy is now...the breakout will most likely be fierce and fast...im expecting the move to occur next week..but never underestimate the continuation of a battle between Bull's and Bear's it can last and long time.


Position: Ultra Long

Tuesday, July 12, 2011

Advanced Micro Devices Revisited: Oversold & Undervalued?

Yesterday Alex Guana an analyst at JP Morgan moreless bashed AMD saying its new fusion chipsets will have no competitive advanatge towards intel, and is moreless no longer a relevant company in the semi-conductor industry. Now his comments may have some merit, but they certainly are biased. Many mainstream desk-top building fans, as well as major companies such as HP typically purchase AMD chipsets due to their performance to price ratio. AMD sells semiconductors that are slightly less powerful than intel's but half the price...in this economy value is what consumers are looking for. Regardless of the constant banter back and forth over what manufactuer is better lets take a look at what the charts have to say.


Based off of technical analysis of AMD here are some points suggesting a trend reversal.
  • The latest trading day has shown the candle stick to close below the lower bollinger band..when this occurs this almost invariably should be used as a entry postion and almost always signals a buy.
  • The CCI indicator is at -293..lmao...when the CCI line crosses -100 its considered very overvalued......i can honestly say i have never seen CCI approach these low levels unless there is some sort of major event or crash.
  • AMD has been in a downwards trend for many weeks now, it seems to gravitating towards a more so sideways trading range..or so i predict. (illustrated with pink trendlines i inserted on the chart) So we can expect to see less volatile price movement.
Overall i think the recent price slide, is the reaction of noise traders and investors towards Alex Guana's comments, as well as the associated slide in the tech sector this week. AMD is a major company and when funds and traders liquidate positions in mutual funds, etf's, or sector based portfolios, AMD being a major tech stock will take a hit on negative volume.

Conclusion? I think AMD is reaching at, or approaching a bottom, and i believe making and entry trade now would be a profitable stratgey.........i expect to see AMD approach $7.60-$8.20 per share in the next 3 or 4 weeks.

Position: Long

Hyperdynamics Corporation: Breakout To be?

While running analysis of a variety of equities Hyperdynamics Corp. (HDY) came up on my screener. I almost invariably prefer to analyze securities that are trading sideways for a period of a week or so. Allows me to look at the previous 3 month trend to allow me to evalute which direction the trend is going.

So far it appears that HDY is a textbook depiction of a Bullish Falling wedge continuation pattern.
  • Contracted Bollinger bands mean a directional breakout is due.
  • Light volume preceded by falling wedge with contracted bands shows the bullish falling wedge pattern is working itself out before breaking out.

Based of the chart, and my analysis of the technicals i would give HDY a long call, it appears a bullish breakout is will occur after this contraction expands.

Position: Ultra Long