Sunday, March 18, 2012

Hyper Dynamics (HDY) : Ascending Triangle Break-out

In the past month shares of HDY have been pounded, following the speculative oil company's failure to spud legitimate oil from their SABU-1 oil well. Regardless the stock plunged from from $2.50 range in late February to the $1.30-$1.40 range through-out this month to this day.

HDY has been bouncing consistently off of the 1.30 support line, this proves to me that the intrinsic supply & demand point has established this price area as being mainline support as well as a price bottom..

Pattern Analysis


What we can see is a few things
  • Text book Ascending Wedge
  • Gap to $2 to fill.
  • the 5th point of the 5-point Ascending Triangle confirmation pattern line is due to touch come Monday.
  • Morning Star Pattern formed in the past 3 days of trading, as well as a bullish engulfing pattern. Both being strong reversal candle patterns.

Volume Analysis


    Above we can see that Accumulation/Distribution & On-balance volume have been oscillating in a range with HDY's price action, this downward sloping trend in volume (light volume since gap down as well) is confirmation a large move is to come, and based off of the chart it looks like a bullish pennant for the volume pattern.
    The supply of HDY on the market has been meet by serious demand in the low 1.30's, volume dictates an over-extension in supply, and bears are loosing power and grow tired. Also there is a 25% short float on the stock, this means shorts will cover once bears loose steam, bringing a major short squeeze play into play. Which will blow HDY's PPS close to 1.80. The continuous decline in volume ended Friday with a 11% gain on 12.4 million shares. That's huge when AVG volume is 3 million shares.
      
    Volatility Analysis
    

For volatility analysis we can see the following
  • Contraction in volatility, squeeze is in progress, this will expanded either upwards or  downwards, and oscillators and momentum indicators strongly suggest upwards.
  • %B indicator shows bounce and should easily pierce 100 line upper band tag.
  • A move is coming soon. Volatility would indicate another swing upwards short term.


MACD Divergence


 We can see a massive divergence signal in HDY's price action as well as its MACD histogram reading. This is a high bullish indication for HDY and also further suggests another run int he equity.


Overall HDY is flagging a buy on many more indicators and analysis methods, i only covered the more important ones. I believe HDY is poised for another major run here shortly. I do currently own 125,000 shares of this company, i purchased last week as well for a nice swing trade.


Position: Long


Target Price: 1.72-1.80 (High) 1.63-1.70(Low)


Sunday, January 29, 2012

Akamai Technologies: AKAM 20% Break-Out Play

AKAM has recently been flagged as a buy,on my discretionary short-run trading system. What we see here is a very profitable application's software company, that runs a very efficient corporate operation. they have an amazingly strong balance sheet, with little to no debt , and do much of their work directly with Apple, as we all know, just had a valuation raise to $560 a share.

AKAM being one of the more profitable companies in the computer service industry has a great pre-break-out chart set up as well, lets take a look.


Above we have the following.


  • Stochastic Over-Sold Crossing Signal.
  • Momentum turning towards a reversal across the 100 line, which is the confirmation to buy.
  • A reliable Ascending Triangle Chart Pattern.

Bollinger Analysis

  • We can also see here from our Bollinger Analysis is that the bands have contracted, indicating that a breakout, either being up or down is due here relatively soon, and since AKAM is in a consolidating oscillating range, using oscillators is the best way to determine if it is under or over priced.
  • Based off of the evidence the indicatoror's suggest that both Bollinger %B and CCI as well as Stochastic & Momentum indactors show that AKAM is oversold greatly.
  • Evidence also suggests AKAM is poised to break-out upwards
All in all, what we have is a financially strong, profitable company, that based off of Technical Analysis is greatly oversold and is poised to climb to a solid $40.00 in the next 3 weeks.

Position: Strong Buy

Target Price: $40.50-$41.00

Sunday, January 22, 2012

Pacific Ethanol Corporation PEIX : Ascending Trinagle Breakout

PEIX is candidate for a easy 15-20% gain. The ethanol producer (being on of the largest producer/distributors on North America) has been trading in a tight consolidation range of an ascending triangle for several days now with declining volume.


  • Ascending Triangle formation, meeting textbook parameters, this chart pattern in a smoking gun for a bullish-reversal due any day now.
  • Declining volume, also goes in par with further confirmation of the ascending triangles up coming bullish movement.


  • Contracted Bollinger Bands also show a movement in price action will occur any day now.
  • Momentum indicator is hugging 100 line, showing the current consolidation in progress as well

Overall PEIX has to move and sometime soon, as we have seen volume gradually fall lower and lower well below the 50-day moving average (of volume) its safe to say we should see a break upwards come Monday or Tuesday, Wednesday at the latest.

I predict we will see the triangle formation broken upwards tomorrow, and the run should be to $1.45-1.50 range.

PEIX: Strong Buy

Price Target: $1.45

Sunday, November 6, 2011

Breakout: Sprint

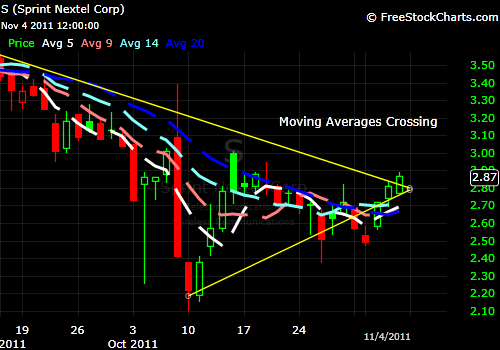
Sprint (S) recently came across my system as a buy based off of some interesting continuation pattern signals. Below is an analysis of some reasons to consider this a high probability equity trade.


  • Ascending Triangle Continuation chart pattern....broke past the pattern line early Friday morning signaling a buy.
  • MorningStar candle pattern followed by a Three White soldiers Candle pattern, both are trend reversal patterns.
  • Declining volume In sync with ascending wedge pattern.


Moving Averages are crossing...and are starting to head forward.

DMI +/- is about to cross as well. All in all sprint is treading near its 52-week low point...and has many indicators and bullish signals going on here. I think a trend reversal is definitely in progress..and Friday was the confirmation day. Buying in right prior to a breakout is how the big gains are made. What really nails the head on this situation is the candle patterns. A Morning star sharing with a Three White Soilders pattern is very rare...and both are very high probability bullish trend reversal patterns.

Position: Long S


Thursday, October 27, 2011

TrinQuint Semi-Conductor: Volatility Spike Play.

Shares of TrinQuint Semi-Conductors (TQNT) tumbled 26% today during trading, due to a failure to beat Wall Street earnings expectations, and had a negative growth forecast due to Apple scaling back on orders for their computer hardware parts. TQNT supplies chips for Apple, the bulk of their business is done with Apple. For more here is the story. http://www.marketwatch.com/story/triquint-announces-third-quarter-2011-results-2011-10-26

 
Regardless, my trading fund has a Relative Value Volatility Arbitrage aspect to it, so anytime i see a equity get hit real hard real fast on a rapid negative volume spike, it comes up on my radar as a possible share price bounce play.


What we can see on the chart above is TQNT was in a long term giant Head & Shoulders chart pattern, and in early October it finally bottomed out and began a new trend upwards. What happened last night was a event driven, fear induced panic, that made people all blow out simultaneously. In reality a 10-15% pull back would have been a understandable behavioral reaction.....but 26%? Definitely way to oversold.

 
What we can see is:
  • Massive sell off occurred on high volume. Generally after a giant down day like this, many traders and investors will come up and snag a bunch of shares at a discount price (in their mind) and will help retrace some of the losses from the prior trading session.
  • Volatility: Any 30% price move in one day, will eventually lead to a mean reversion to moving averages or linear regression lines. This event is not that serious that it wont recover from this behavioral sell off.
  • The Professionals: Best believe Market Makers, Hedge Fund Managers, Professional Equity Traders will come in and accumulate this stock for a easy 10-15% pop upwards in the next coming weeks. 


Above:  Linear Regression Analysis.
  • Above we can see that TQNT is trading well below its linear regression levels by at least .45 cents a share. We can fully expect to see a reversion to that mean of 5.80 within a few weeks at the latest.
  • 60 day Lin-Reg line is at $5.80 Per Share
  • 30 day Lin-Reg line & Lin-MA is at $7 Per Share


Above: Mean Reversion Analysis Using Simple Moving Averages

  • All moving averages suggest a reversion back to the mean target range of $6.25 Per Share on a monthly basis & $7.00 Per Share on a Weekly Basis.
  • Realistically longer ranging Moving Averages are more accurate after short term event fluctuations.
In the end TQNT may have some issues, but its appears to be very oversold at this point, i believe it bouncing back to 6.50-7 within a month is not a unreasonable assumption and should come to fruition. But with the market acting the way it is nowadays, anything can happen.

Position: Long TQNT

Thursday, September 15, 2011

Hyper Dynamics Corp: Break-out Deja Vu?

Hyper Dynamics (HDY) has recently been flagged by multiple signals from my system as a possible pre-breakout phase, consolidated equity. We have been down this road before with this equity, it proves to be profitable time and time again, and its the same pattern we see now that we saw before the last breakout. Lets take a look.


What we can see?
  • Contracted Bollinger Bands. Volatility is becoming contracted, when the BBands contract, it always leads to a new trending direction.
  • My 13,26 Dual Moving Average system crossed over, signalling a buy. Every time this system crossed over, a new upwards trend began.
  • We can see a classic Bullish Pennant or Wedge its debatable but both are consistently profitable.

In association with volatility contraction and the formation of a very reliable and profitable chart pattern, we can also see that HDY has fallin into a consolidation non-trending sideways trading range. What that means is simple, before periods of great share price movement there is normally a consolidating or small range of price change.
  • ADX signals non-trending, consolidation.
  • ATR signals non-trending, consolidation.
  • Bollinger Band Width signals non-trending consolidation.
  • DMI/+/- is about to cross-over.
What this means is there is going to be a breakout in share price, and soon. The million dollar question is what direction? Well there is limited reason to believe it will break-out downwards. This exact same pattern formation a month ago lead to a 35% gain. Here are some reasons why it will break upward
  • Months of large institutional quite buying.
  • Large insider share buying.
  • Tomorrow, September options expire, strike price is 4$ and 5$, Algos say 5$ is the target, meaning that HDY should soon be pushed to 5$ per share.
  • Declining Volume, which is 90% accurate when used with a pennant as bullish confirmation.
  • Large community bullish sentiment
  • HDY's recent promotion from the AMEX to the NYSE
  • Current candlestick is at the Pivot Point. Suggesting a move.
Some of my other Oscillators such as MACD and Stochastic's also indicate a buy signal.

All in all i think HDY is poised to breakout upwards once again. I would estimate based off of volatility range and previous breakouts, we can see HDY hit $5.50 a share to possibly $6.50 a share.
Lets hope this bad boy blows upwards come Monday or Tuesday.

Position: Long HDY


Wednesday, September 7, 2011

Alcoa Inc: New Upward trend in development?

I recently placed a large trade on Alcoa Steel at 12.11$ a share. Seems to have been a casualty of the recent market sell off last week. The companies fundamental's have not changed, so obviously it's recent 2$-3$ fall in share price is a result of funds selling off positions out of fear, and Alcoa's shares getting tied up with the indices recent retracement.


I believe this to be a Bullish Pennant, although due to recent overall market volatility its hard to find accurate continuation patterns, so it may be a Triple Bottom with a breakout to come soon. Here are some thoughts.
  • AA is at a 52-low area
  • AA is current trading at its pivot point area.
  • AA's lowest short term support level is $11.11
  • 10 day SMA crossed over 20 day SMA, as well as ADX declining at 35, this suggests a new upwards trend is to begin, and todays recent small gap up may be the beginning of new upwards movement.
All in all i think AA is a potential bottomed out equity that is poised to at leas hit 12.75$-13$ a share with the next week or so.

Position: Long AA