
- Ascending Triangle Continuation chart pattern....broke past the pattern line early Friday morning signaling a buy.
- MorningStar candle pattern followed by a Three White soldiers Candle pattern, both are trend reversal patterns.
- Declining volume In sync with ascending wedge pattern.
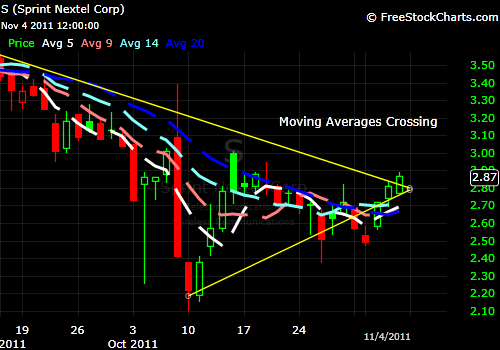
Moving Averages are crossing...and are starting to head forward.
DMI +/- is about to cross as well. All in all sprint is treading near its 52-week low point...and has many indicators and bullish signals going on here. I think a trend reversal is definitely in progress..and Friday was the confirmation day. Buying in right prior to a breakout is how the big gains are made. What really nails the head on this situation is the candle patterns. A Morning star sharing with a Three White Soilders pattern is very rare...and both are very high probability bullish trend reversal patterns.
Position: Long S